Data analytics that decision-makers can trust
Pipelines, models, and dashboards grounded in clear definitions — so reports stop arguing with each other.
- Conflicting metrics across teams because source definitions differ
- Fragile ETL jobs that fail silently until someone notices late
- Dashboards built without ownership of the underlying tables

What we deliver
Enterprises rarely lack data. They lack agreed definitions, reliable pipelines, and reporting that survives a finance review. We fix the foundations before adding more dashboards.
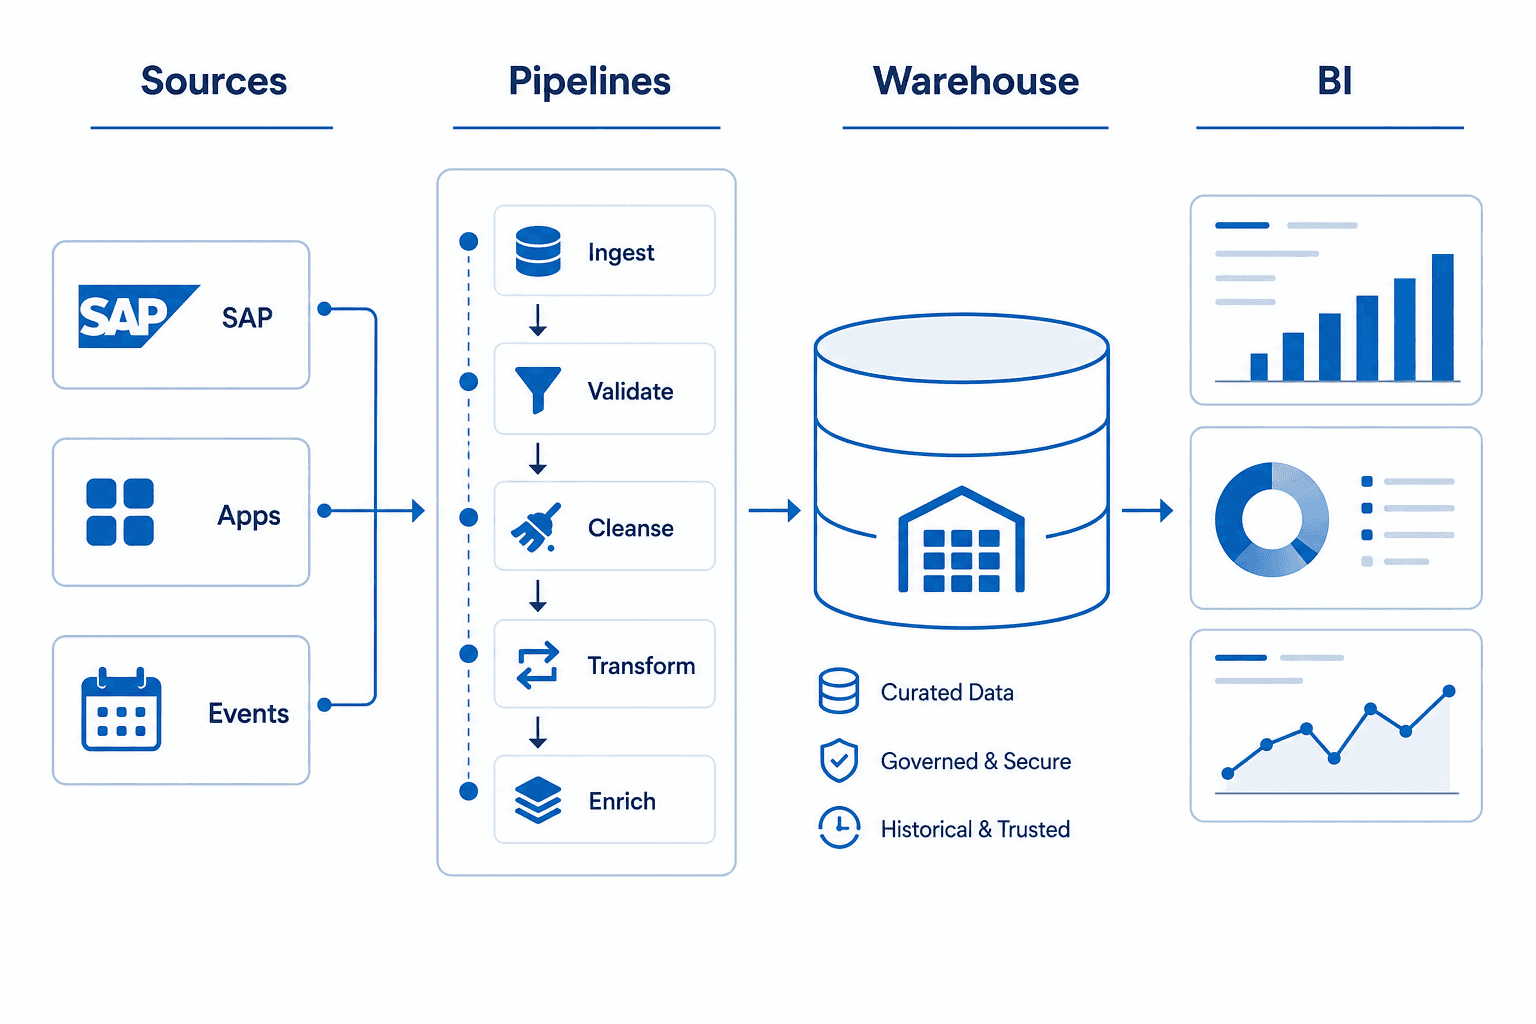
- Source-to-warehouse pipeline design
- Scheduled transforms with monitoring
- Basic data quality checks on critical fields
- Metric definitions documented with owners
- Power BI or Tableau reports for priority use cases
- Access patterns aligned to roles
- Dimensional or wide-table models as appropriate
- Version-controlled transform code
- Handover notes for your data team
- Event or CDC-based feeds where justified
- Operational dashboards with clear refresh SLAs
- Alerting on pipeline health
How we work
- 1
Define
Agree the questions that matter and the metric definitions that answer them.
- 2
Model
Design sources, transforms, and storage for those questions — nothing more.
- 3
Build
Implement pipelines and reports with tests on the fields that drive decisions.
- 4
Enable
Train owners, document refresh and escalation paths, then step back.
Technologies we work with
Stacks and platforms we use on this kind of work — not a partnership claim.
Languages
- Python
- R
- SQL
Pipelines
- Spark
- Kafka
Storage
- PostgreSQL
Business intelligence
- Power BI
- Tableau
Common questions
Do you start with a full data lake project?
Usually no. We start with the highest-value reporting or operational use cases and expand the platform only when those paths are solid.
Can you work with SAP as a source system?
Yes. Extracting and modelling SAP data for analytics is a common request alongside our SAP services work.
Who owns the dashboards after delivery?
Your named business and data owners. We document refresh schedules, metric definitions, and how to request changes.
